India EV Sales August 2026: Record 2.98 Lakh EVs, Up 52.9% — What’s Real vs Low-Base Effect
Stay connected via Google 'Electric Vehicle' News
Follow BijliWaliGaadi | India's Trusted EV Insights Portal
source on Google
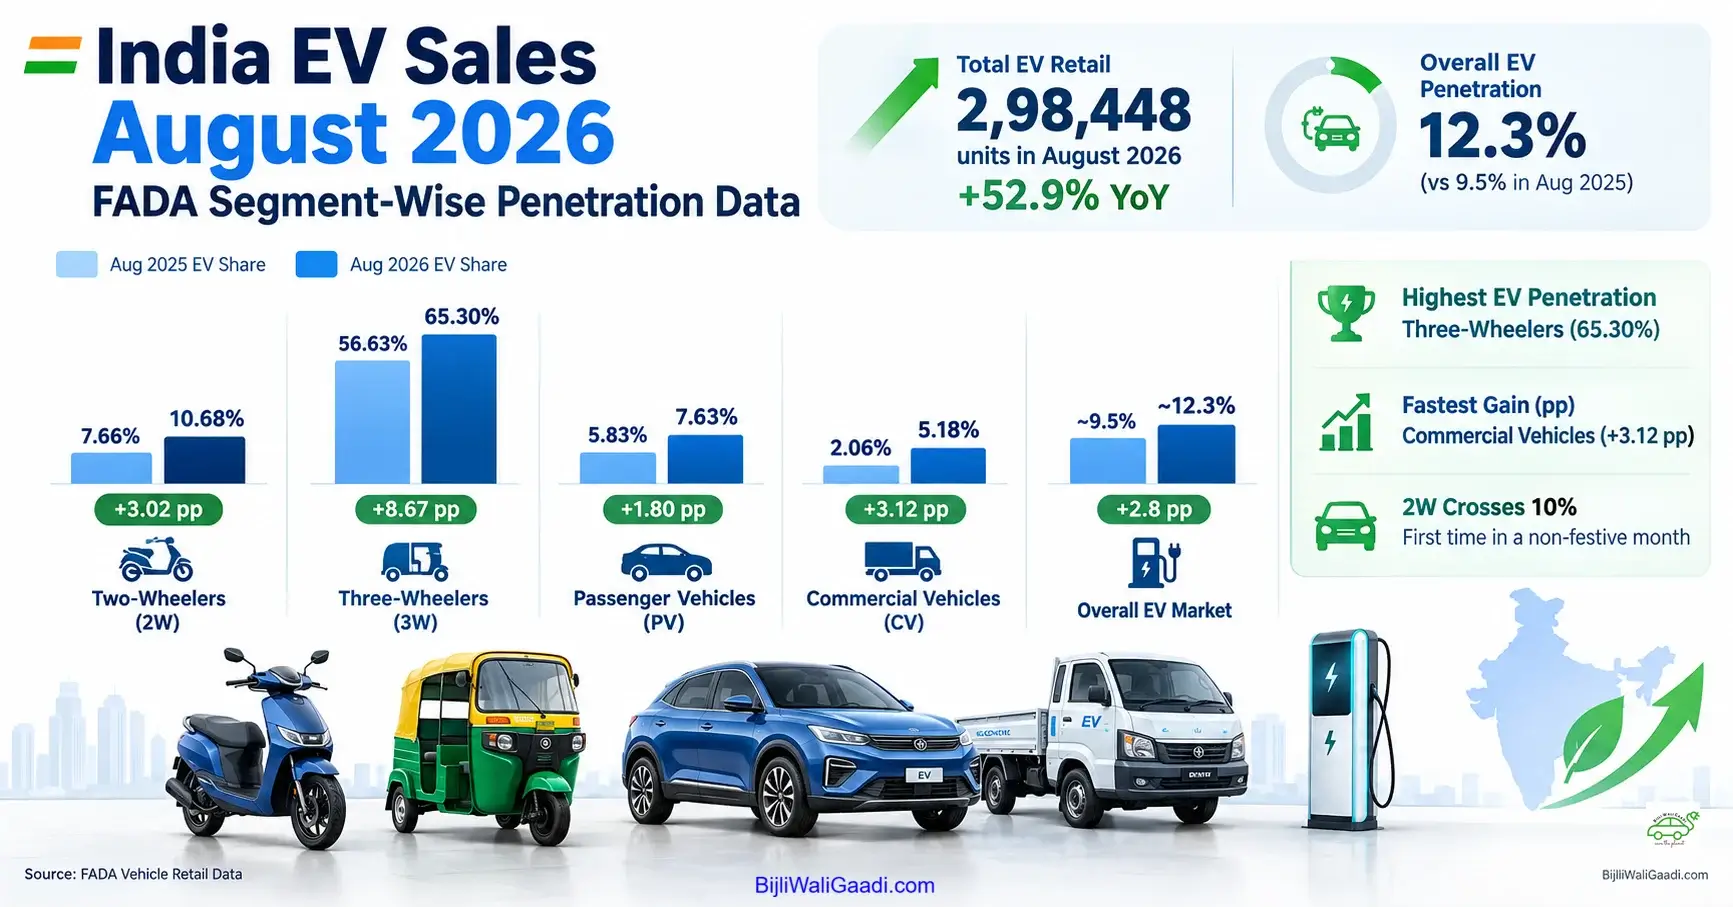
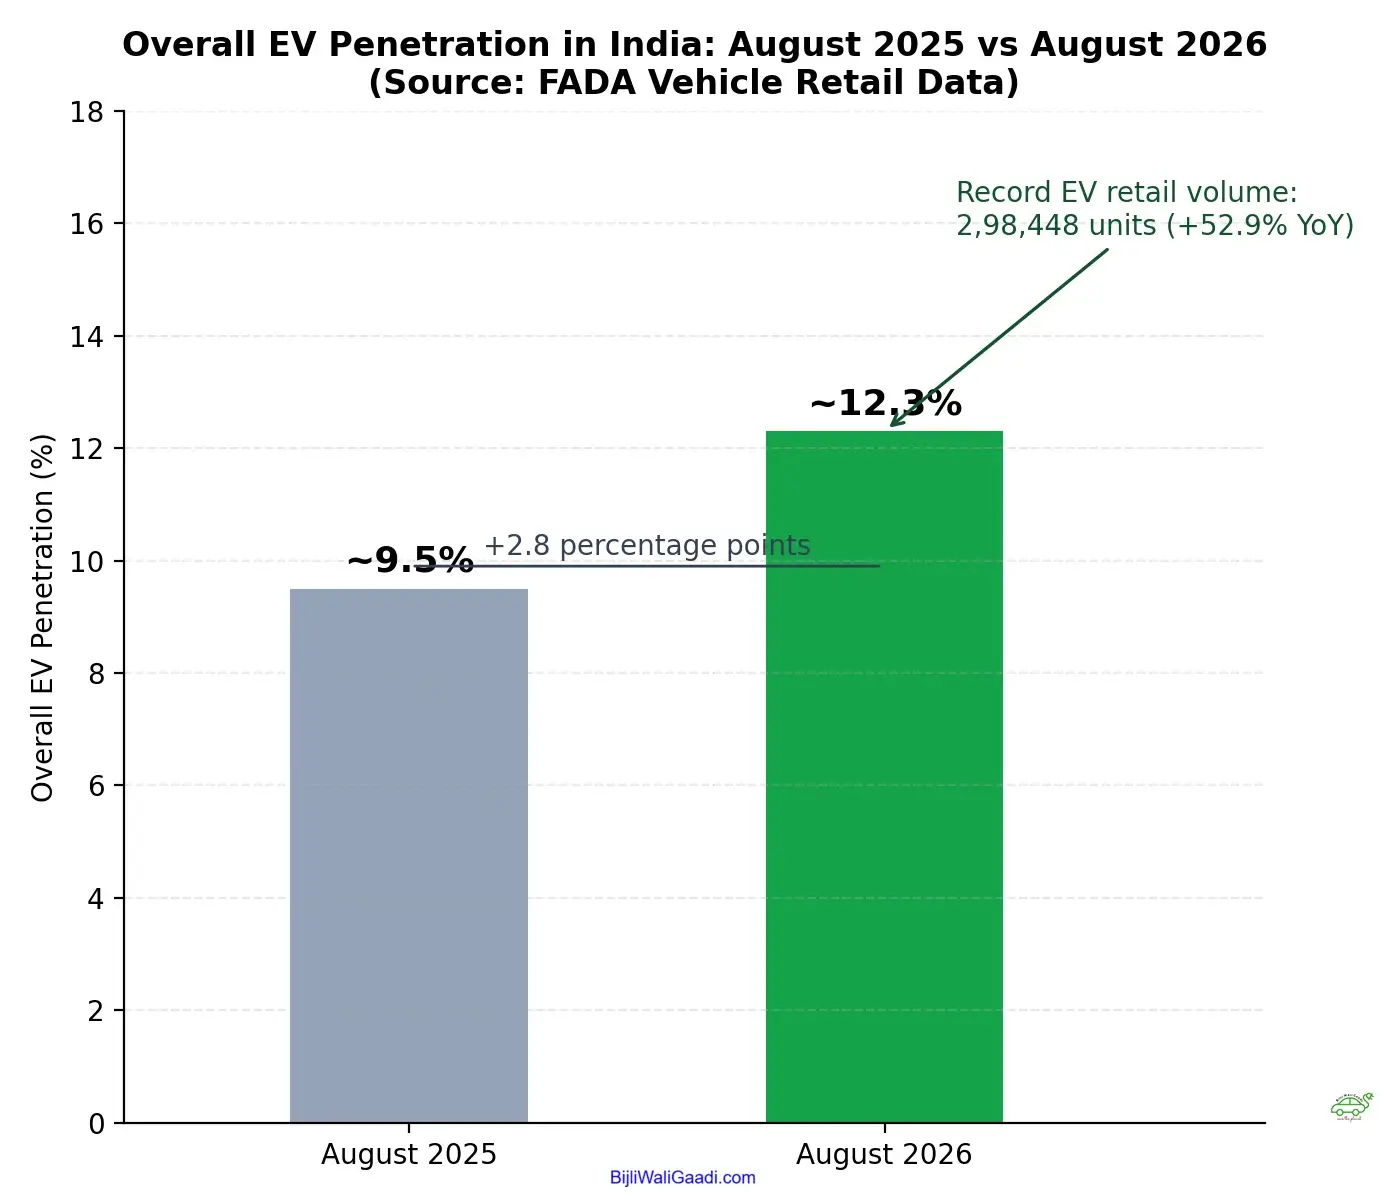
India retailed 2,98,448 electric vehicles in August 2026, FADA‘s biggest-ever August EV volume, up 52.9% year-on-year. Overall EV penetration rose to roughly 12.3% of all vehicle retail, from about 9.5% a year earlier.
That headline is genuine. But August 2025 was also a soft month, with buyers deferring purchases ahead of the GST 2.0 rate cut — a base effect that flatters every YoY comparison this year. The real question isn’t whether the growth rate is impressive. It’s whether EV penetration itself is actually rising. FADA’s data says yes, unevenly, across every major segment.
What Happened to India’s EV Sales in August 2026?
Total EV retail of 2,98,448 units compares with an overall auto retail market of 24,23,201 units, up 17.51% YoY, according to FADA. EVs grew roughly three times faster than the total market.
August retail was lower than July across most major categories. FADA attributed this broader sequential decline to the seasonal monsoon lull and to a festival calendar that shifted Ganesh Chaturthi and Onam-linked buying into September — not to any EV-specific factor.
FY27 retail through the first five months (April–August 2026) was up 18.47% YoY, per FADA, giving the August EV numbers a broader growth backdrop to sit against.
Which EV Segment Is Actually Growing Fastest?
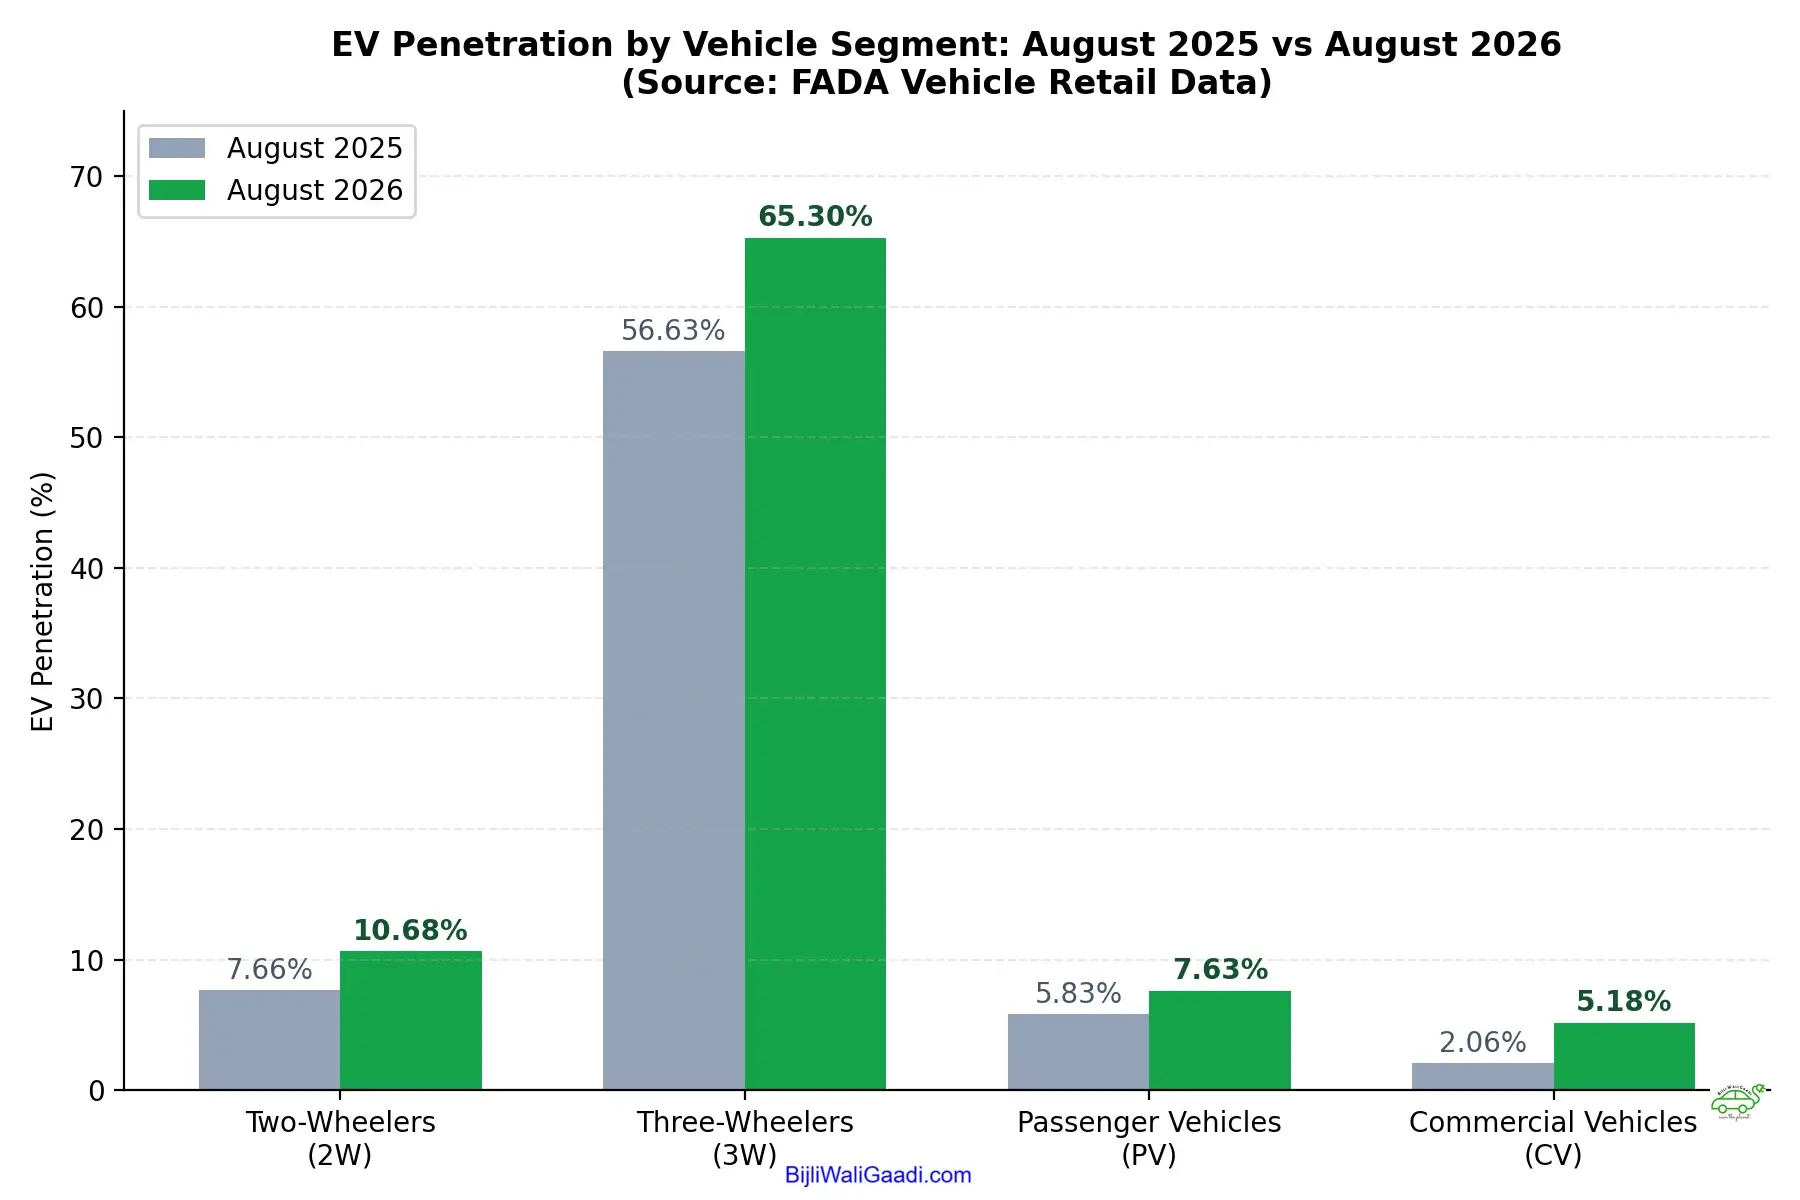
By penetration gain, electric CVs moved the most in percentage-point terms: from 2.06% in August 2025 to an all-time-high 5.18% in August 2026, a gain of 3.12 percentage points. FADA also confirms e-CV volumes hit a record monthly high.
This segment remains far smaller in absolute terms than 2W or 3W EVs, so any unit-growth figure calculated from these shares would carry a very low base and should be read cautiously rather than treated as a headline number.
Electric PVs gained 1.80 percentage points (5.83% to 7.63%), a smaller move in penetration terms but one that came inside a passenger vehicle market that itself hit a record August.
Electric Two-Wheelers Cross the 10% Threshold
Electric two-wheeler penetration reached 10.68% in August 2026, up from 7.66% a year earlier — a gain of 3.02 percentage points. FADA said 2W EV penetration crossed the 10% mark in a non-festive month for the first time.
The trend is not perfectly linear: July 2026 EV two-wheeler share was actually higher, at 11.24%, so August’s 10.68% represents a sequential dip even as the YoY trajectory stayed strongly positive. The takeaway is that two-wheeler electrification is on a clear upward YoY path, but month-to-month penetration will keep fluctuating around festive and seasonal cycles.
Three-Wheelers Are Already Structurally Electric
Three-wheeler EV penetration climbed to 65.30% in August 2026 from 56.63% a year earlier, a gain of 8.67 percentage points — comfortably the highest EV share of any major vehicle category FADA tracks.
Three-wheelers are already India’s most electrified major vehicle category, with nearly two-thirds of August retail being electric. That still leaves real room for further electrification in the remaining roughly one-third of the segment.
Electric Cars Are Gaining, But Petrol Still Leads
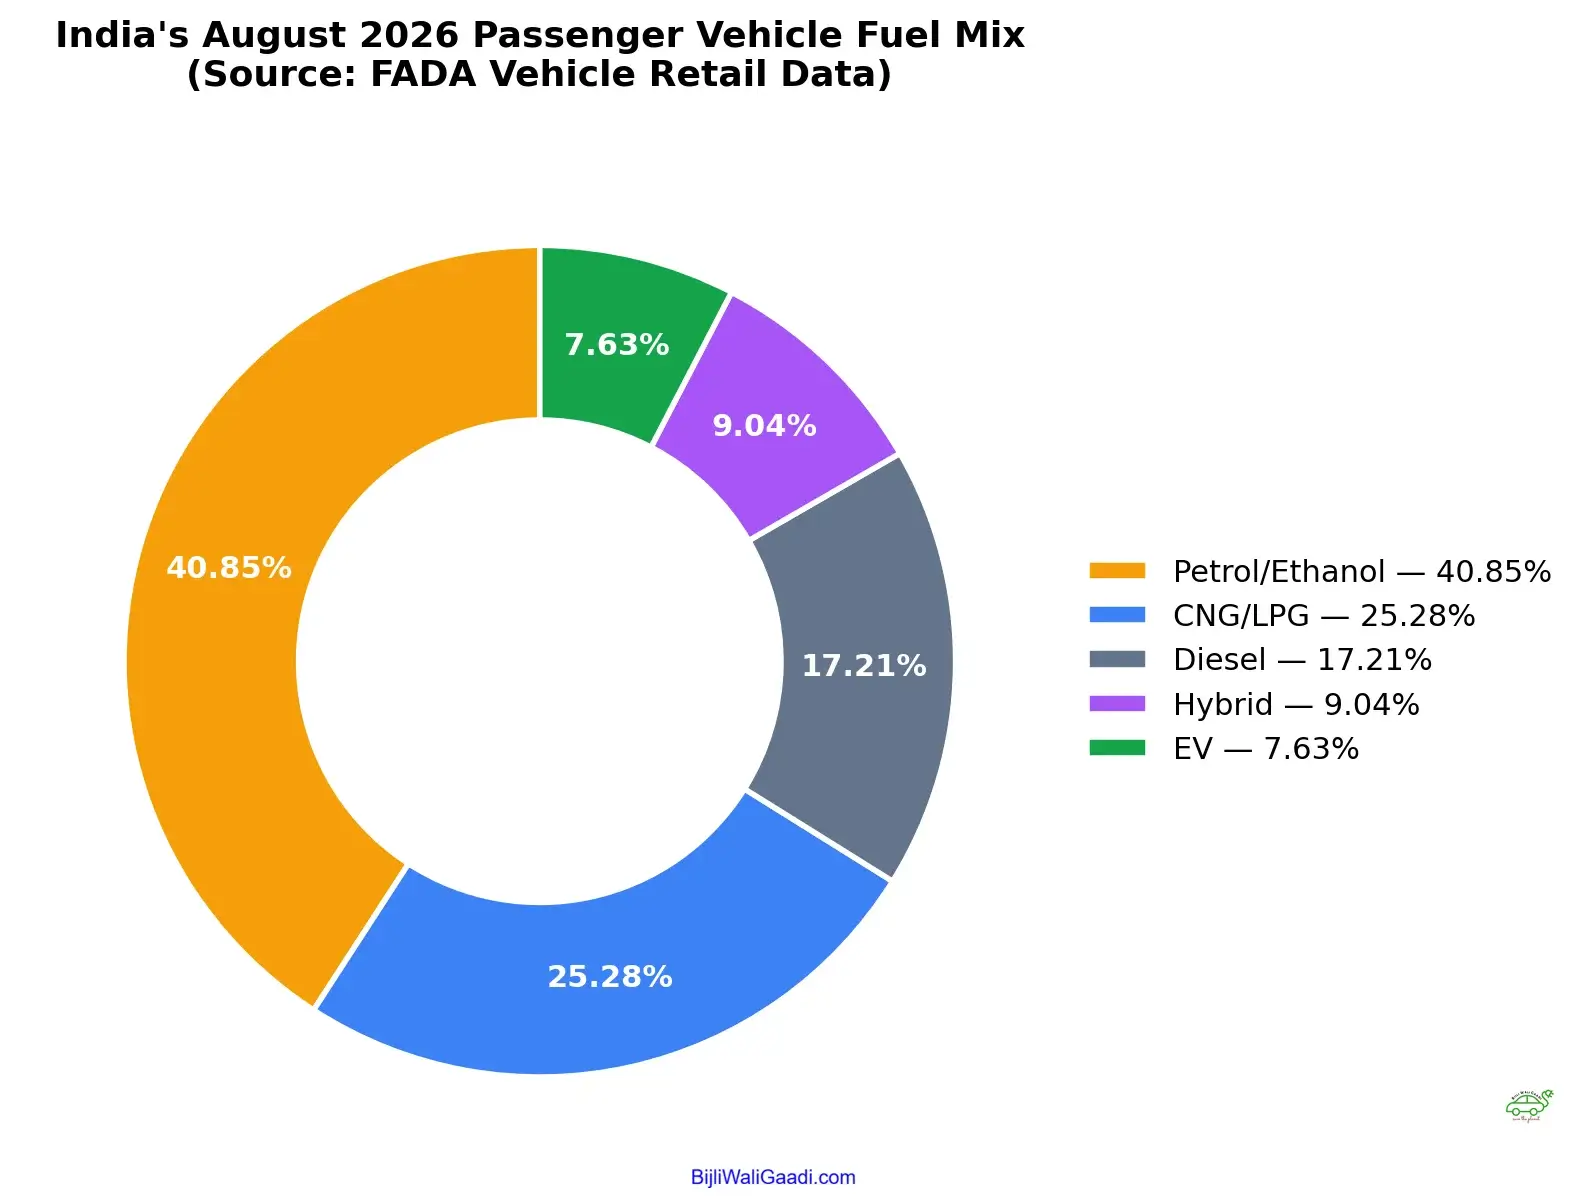
PV EV penetration increased from 5.83% to 7.63% YoY, a gain of 1.80 percentage points. In the same period, alternative fuels — CNG/LPG, hybrid and EV combined — reached 41.95% of PV retail, overtaking petrol/ethanol’s 40.85% for the first time in FADA’s reporting.
This is an important distinction: EVs did not individually overtake petrol. CNG/LPG (25.28%) and hybrid (9.04%) did more of the work than EV (7.63%) in that combined figure. Petrol/ethanol remains the single largest individual fuel category in passenger vehicles, even after losing its combined-share lead.
How Much of August’s EV Growth Is Structural?
August 2025’s softness — driven by GST 2.0-related purchase deferrals — means every YoY growth number this August is amplified by a favourable base. That applies to EVs as much as to the overall market.
But the base effect alone doesn’t explain rising EV penetration. EV penetration increased year-on-year across the four major vehicle categories highlighted by FADA — 2W, 3W, PV and CV — which is a different and more durable signal than a one-time volume bounce. Three-wheelers are already structurally electric; two-wheelers have crossed a meaningful 10% line; passenger EVs continue to gain share inside a fast-growing PV market; and commercial EVs are scaling, from a much smaller base than the others.
The honest read: August 2026 combines a favourable low-base effect with genuine, broad-based gains in EV penetration. Neither fact cancels out the other.
What September–November Will Reveal
FADA reports that 81.62% of dealers expect growth over September–November, the festive core of the year, running through Navratri to a November Diwali. That reading has moderated slightly from the prior month’s outlook.
FADA also flagged elevated PV inventory of roughly 38–40 days, against its recommended 21-day benchmark, as a channel-level risk heading into the festive stocking period. For EVs specifically, the next quarter’s real test is whether two-wheeler penetration holds above 10% through the festive rush, whether three-wheelers keep climbing past 65%, and whether e-CV volumes convert this month’s record into a sustained run rate.
Data Table: EV Penetration by Segment, August 2025 vs. August 2026
| Segment | Aug 2025 EV Share | Aug 2026 EV Share | Change | August 2026 Interpretation |
| Two-Wheelers (2W) | 7.66% | 10.68% | +3.02 pp | Crossed 10% in a non-festive month |
| Three-Wheelers (3W) | 56.63% | 65.30% | +8.67 pp | Highest EV penetration of any major segment |
| Passenger Vehicles (PV) | 5.83% | 7.63% | +1.80 pp | Growing, but still a minority fuel choice |
| Commercial Vehicles (CV) | 2.06% | 5.18% | +3.12 pp | Record penetration, growing off a low base |
| Overall EV Market | ~9.5% | ~12.3% | +2.8 pp | Record 2,98,448 EV retail units, +52.9% YoY |
All penetration percentages and the overall EV total (2,98,448 units, +52.9% YoY) are as directly reported by FADA.
FAQs:
Stay connected via Google 'Electric Vehicle' News
Follow BijliWaliGaadi | India's Trusted EV Insights Portal
source on Google