Electric Three-Wheelers Hit 65% Market Share in India — Here’s Why Commercial EVs Are Winning the Race
Stay connected via Google 'Electric Vehicle' News
Follow BijliWaliGaadi | India's Trusted EV Insights Portal
source on Google

Nearly two out of every three three-wheelers sold in India in August 2026 were electric. Electric commercial vehicles just posted 188.29% YoY growth. Passenger EVs, by comparison, sit at 7.63% penetration. The gap points to where India’s EV transition is currently strongest: commercial-use vehicles with high utilisation and cost-sensitive operating economics.
FADA’s August 2026 Vehicle Retail Data, together with the supplied FADA Research OEM tables for electric three-wheelers and electric commercial vehicles, confirms this pattern in granular detail, down to the OEM level.
Why Three-Wheelers Are India’s EV Adoption Leader
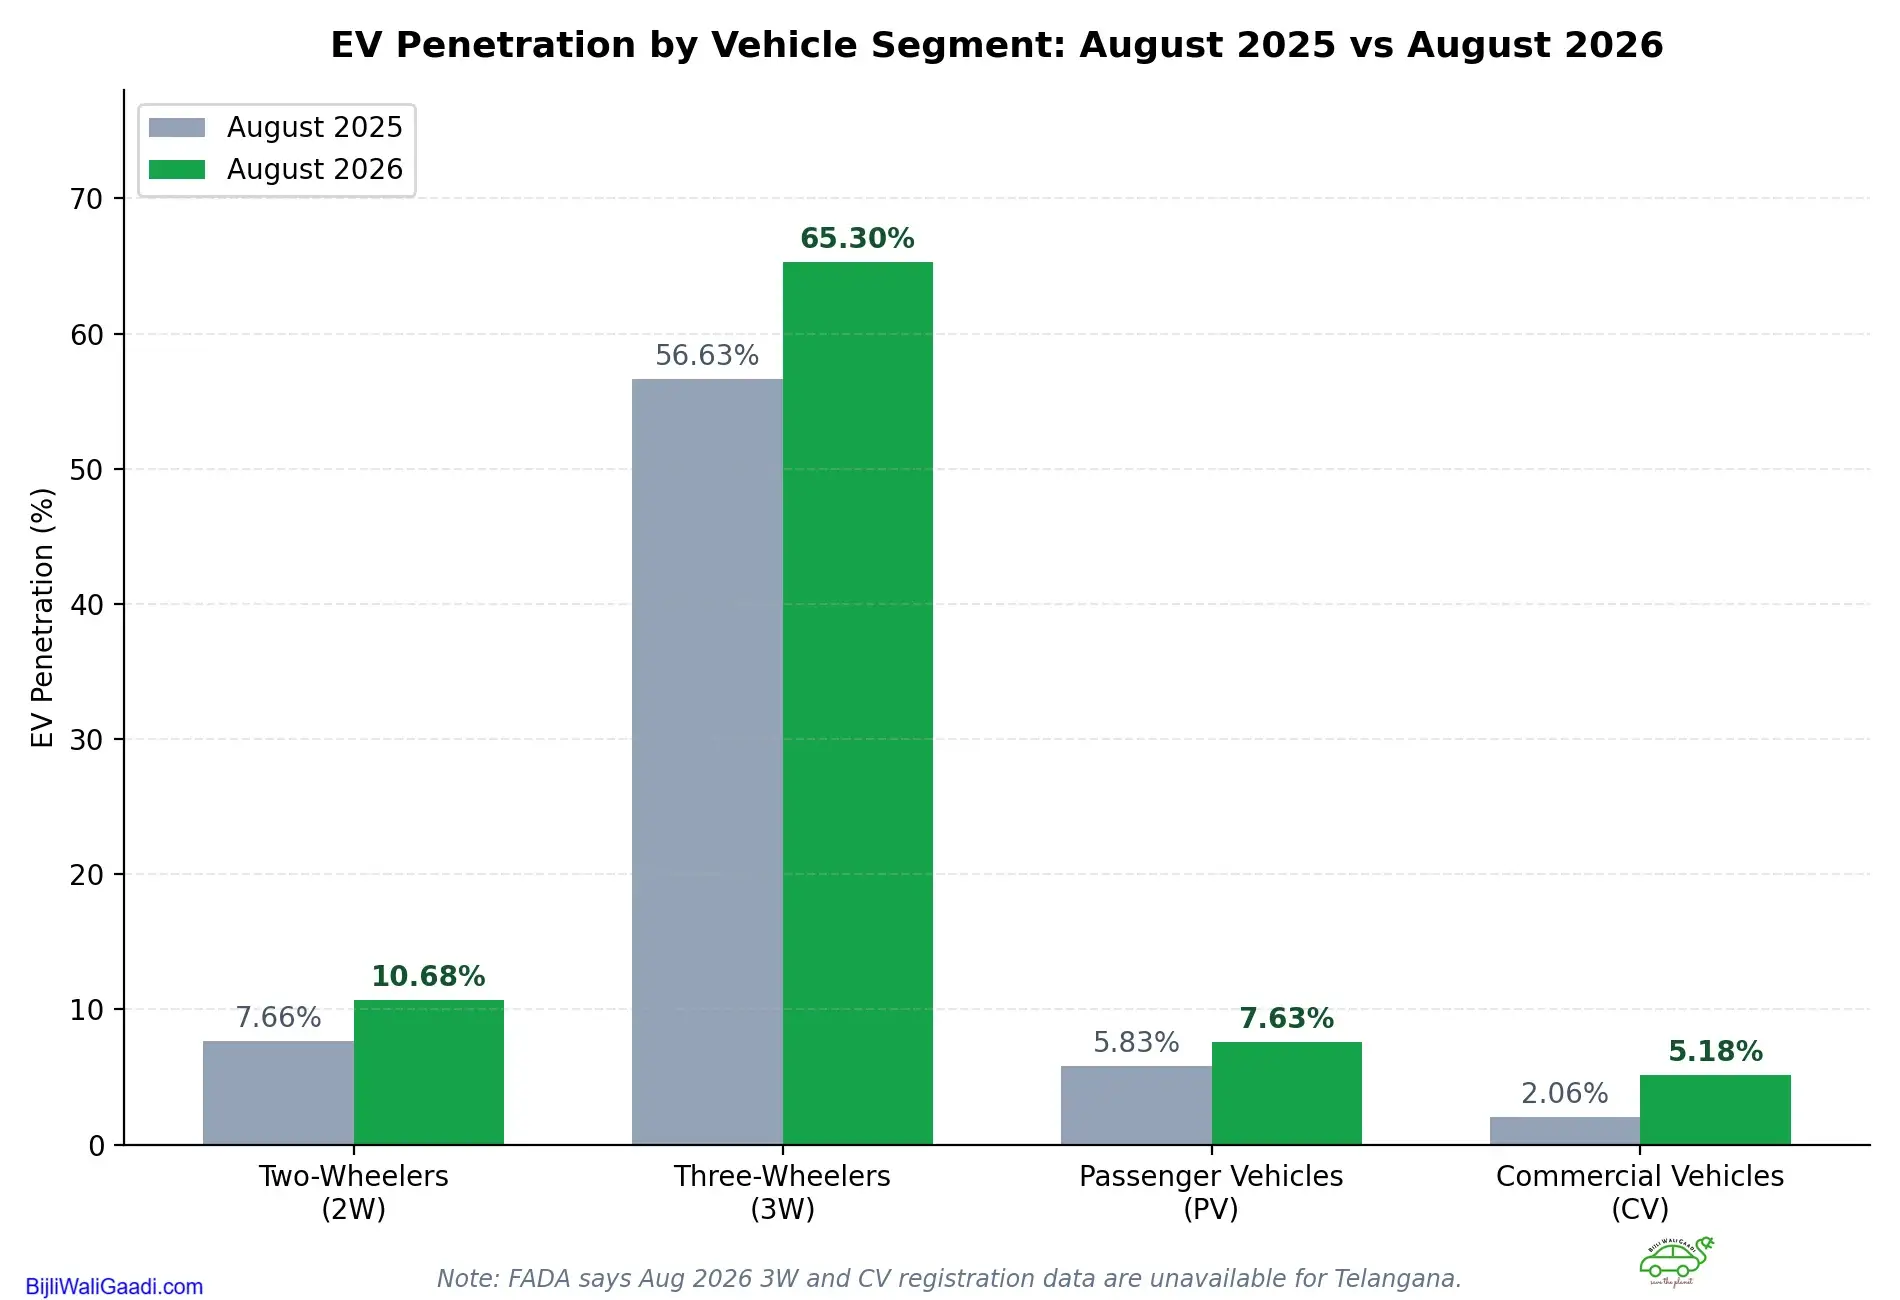
Electric three-wheeler penetration reached 65.30% in August 2026, up from 56.63% a year earlier — a gain of 8.67 percentage points, and comfortably the highest EV share of any vehicle category FADA tracks. Total three-wheeler retail was 1,22,281 units, up 8.64% YoY.
August’s 65.30% was also a sequential high, slightly above July’s 65.07% — a gain of roughly 0.23 percentage points month-on-month. This is a different pattern from two-wheelers, where August’s 10.68% EV share was actually a step down from July’s 11.24%.
For comparison, electric two-wheelers stand at 10.68% penetration and electric passenger vehicles at 7.63%. No other segment comes close to three-wheelers on EV penetration.
Important data note: FADA says August 2026 registration data for three-wheelers and commercial vehicles are not available for Telangana. Therefore, the August 2026 3W and CV retail totals and related calculations in this article should be read as FADA-reported data excluding Telangana. FADA’s August 2026 data was collated on 4 September 2026 from 1,467 of 1,469 RTOs.
FADA’s broader three-wheeler data also shows an uneven category mix: three-wheeler goods retail rose 42.76% YoY and three-wheeler passenger retail increased 23.11%, while e-rickshaw passenger volumes fell 22.03%. These are overall three-wheeler sub-category figures rather than EV-only results, so they should not be treated as direct evidence of where electric 3W demand is growing fastest. Rural three-wheeler retail rose 23.95% YoY while urban retail declined 6.95%, highlighting a strong rural contribution to the broader 3W market.
August 2026 Electric Three-Wheeler Sales
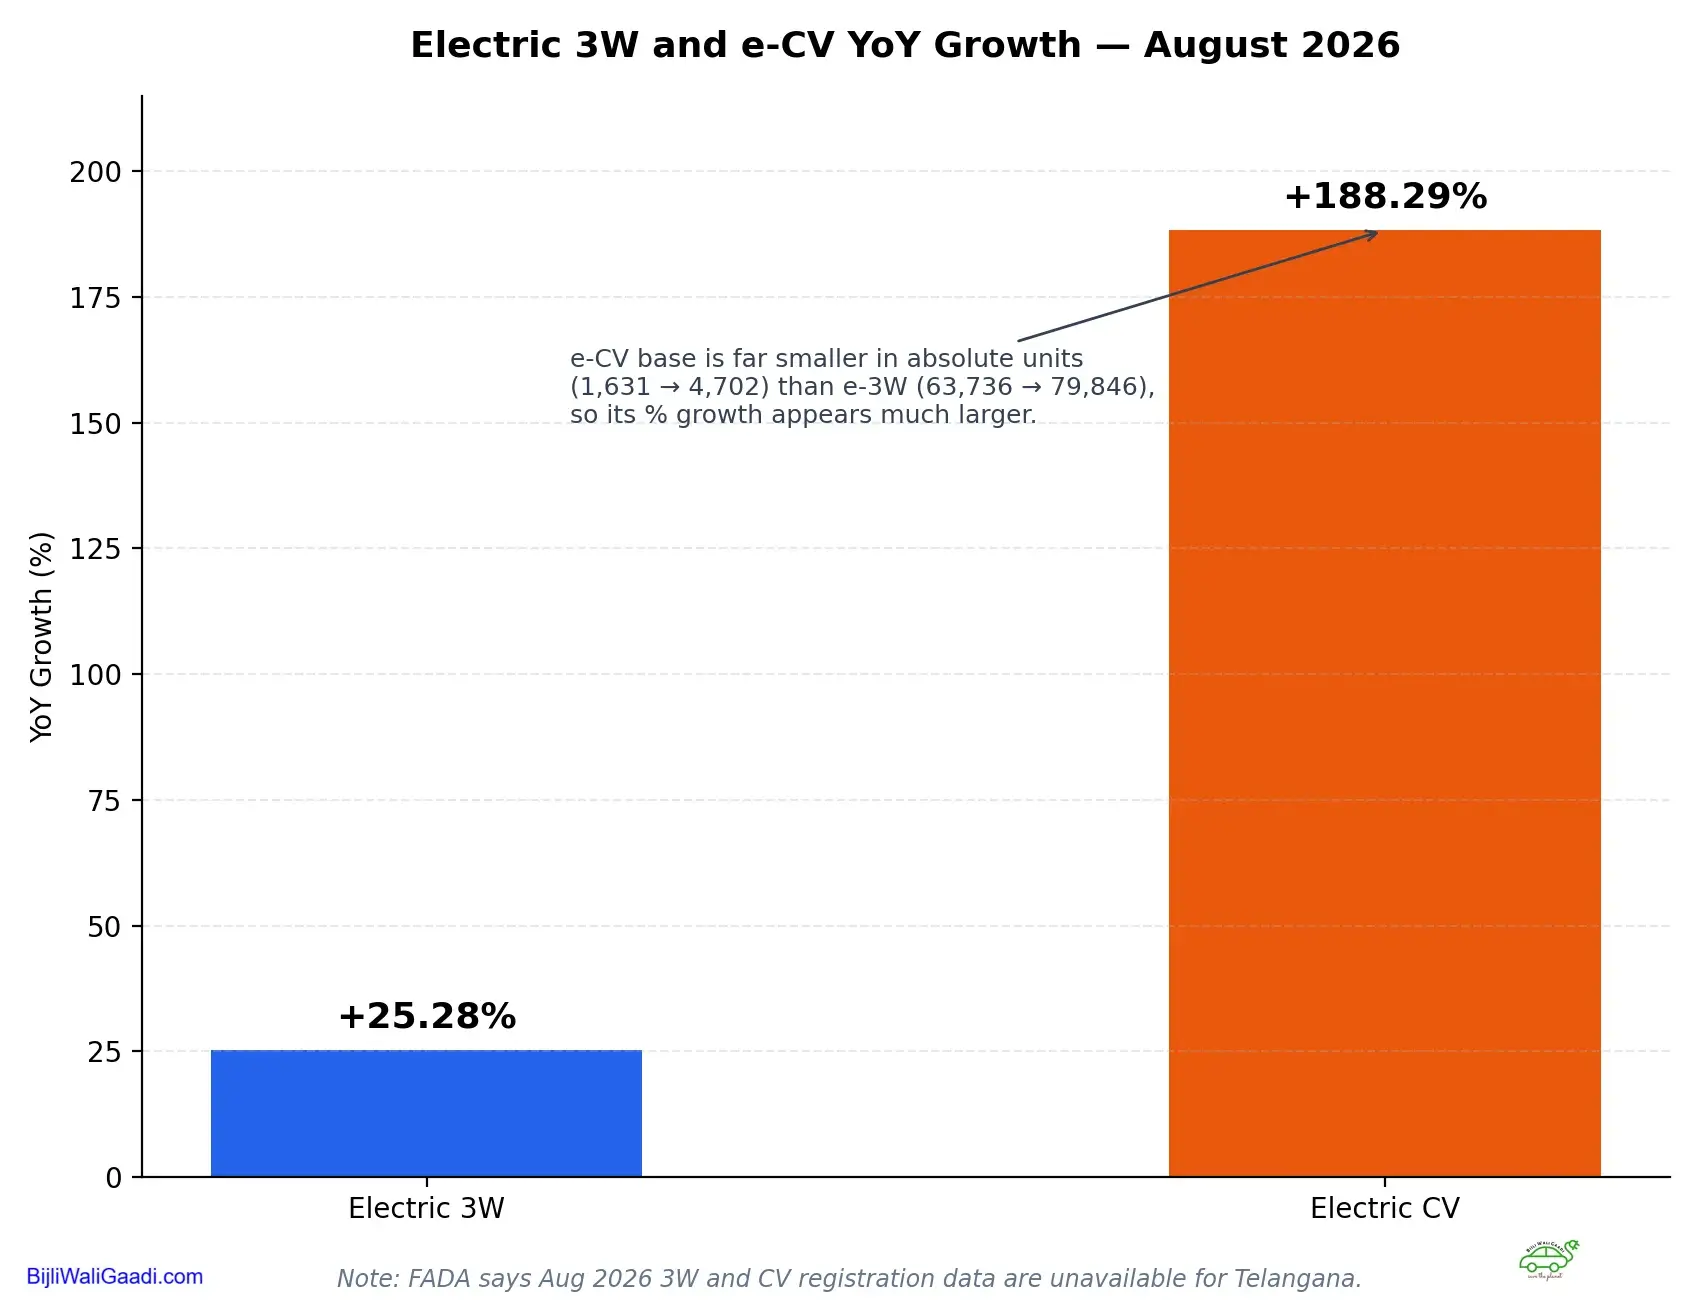
Electric three-wheeler retail totalled 79,846 units in August 2026, against 63,736 units in August 2025, implying 25.28% YoY growth. Sequentially, e-3W volumes declined 8.28% from July’s 87,055 units. The supplied FADA Research OEM/fuel data supports these electric 3W unit figures.
At the OEM level, Bajaj Auto led with 13,833 electric three-wheelers (+117.19% YoY), followed by Mahindra Last Mile Mobility at 12,806 units (+45.29% YoY) and TVS Motor Company at 4,415 units (+93.64% YoY). Several smaller players — Dilli Electric Auto, Saera Electric, Piaggio, and Omega Seiki among them — posted mixed results, with some declining YoY even as the category as a whole grew, a reminder that segment-level growth isn’t evenly distributed across OEMs.
| Electric Three-Wheeler OEM | Aug 2026 | Jul 2026 | Aug 2025 | MoM | YoY |
| Bajaj Auto | 13,833 | 13,442 | 6,369 | +2.91% | +117.19% |
| Mahindra Group | 12,819 | 14,191 | 8,838 | -9.67% | +45.04% |
| — Mahindra Last Mile Mobility | 12,806 | 14,177 | 8,814 | -9.67% | +45.29% |
| — Mahindra & Mahindra Limited | 13 | 14 | 24 | -7.14% | -45.83% |
| TVS Motor Company | 4,415 | 4,473 | 2,280 | -1.30% | +93.64% |
| YC Electric Vehicle | 2,208 | 2,388 | 3,421 | -7.54% | -35.46% |
| Dilli Electric Auto | 1,781 | 1,843 | 1,816 | -3.36% | -1.93% |
| Saera Electric Auto | 1,702 | 1,815 | 2,172 | -6.23% | -21.64% |
| Piaggio Vehicles | 1,511 | 1,529 | 1,213 | -1.18% | +24.57% |
| Mini Metro EV | 1,330 | 1,581 | 1,144 | -15.88% | +16.26% |
| J.S. Auto | 1,286 | 1,341 | 938 | -4.10% | +37.10% |
| Energy Electric Vehicles | 926 | 994 | 1,079 | -6.84% | -14.18% |
| Omega Seiki | 918 | 866 | 411 | +6.00% | +123.36% |
| SKS Trade India | 849 | 883 | 839 | -3.85% | +1.19% |
| Others | 36,268 | 41,709 | 33,216 | -13.05% | +9.19% |
| Total | 79,846 | 87,055 | 63,736 | -8.28% | +25.28% |
Source: FADA Research. TS (Telangana) data not available for the 3W category; data collated 04.09.2026 from 1,467 of 1,469 RTOs.
FADA’s fuel-wise retail data show the electric three-wheeler penetration trend directly: 65.30% in August 2026, versus 65.07% in July 2026 and 56.63% in August 2025 — confirming that August’s penetration was both a strong YoY gain and a fresh sequential high, unlike the two-wheeler segment where August dipped slightly from July.
Why Commercial Economics Favour EVs
Three-wheelers and commercial vehicles share structural traits that passenger cars don’t: high daily utilisation, predictable routes, and running costs that are scrutinised far more closely than sticker price. For an operator doing 100+ km a day, fuel savings compound quickly and can offset a higher upfront cost within a fleet’s typical ownership cycle.
Charging can also be planned around fixed schedules — a rickshaw returning to a hub each night, or a delivery van on a set route — reducing the range anxiety that weighs more heavily on private car buyers with unpredictable trip patterns. It’s worth stressing that these are analytical factors this publication is putting forward to interpret the data, not conclusions FADA itself has established or survey findings from FADA; the retail numbers show the outcome (electrification), not the specific reasons operators chose it.
Total cost of ownership arguably matters more to a fleet operator or a three-wheeler driver’s daily earnings than it does to a private car buyer weighing brand, styling, and resale value. That economics-led purchase logic may help explain why commercial categories currently lead passenger vehicles on EV penetration, although FADA’s retail data do not establish causation.
Are Electric Commercial Vehicles Finally Scaling?

Electric CV penetration jumped to an all-time high of 5.18% in August 2026, from 2.06% a year earlier — a gain of 3.12 percentage points. In unit terms, e-CV retail reached an all-time monthly high of 4,702 vehicles, up 188.29% YoY from 1,631 units, and up 32.23% sequentially from July’s 3,556 units, per the supplied FADA Research data.
This is still a small base relative to three-wheelers or two-wheelers, so the triple-digit growth rate should be read as an early-stage scaling story, not evidence the segment has matured. Tata Motors led e-CV retail at 1,416 units (+216.07% YoY), with Euler Motors at 849 units (+961.25% YoY) and Mahindra Group at 360 units (+38.46% YoY).
Sany Heavy Industry illustrates the low-base effect particularly clearly: its retail volume rose from just 1 unit in August 2025 to 605 units in August 2026. That produces an exceptionally large percentage increase, but the absolute volume remains below the segment leaders, despite the exceptionally high percentage growth.
| Electric Commercial Vehicle OEM | Aug 2026 | Jul 2026 | Aug 2025 | MoM | YoY |
| Tata Motors | 1,416 | 1,306 | 448 | +8.42% | +216.07% |
| Euler Motors | 849 | 777 | 80 | +9.27% | +961.25% |
| Sany Heavy Industry India | 605 | 43 | 1 | +1306.98% | +60400.00% |
| Mahindra Group | 360 | 362 | 260 | -0.55% | +38.46% |
| Electra Greentech | 315 | 133 | 99 | +136.84% | +218.18% |
| Switch Mobility Automotive | 280 | 192 | 273 | +45.83% | +2.56% |
| IPL Tech Electric | 174 | 59 | 40 | +194.92% | +335.00% |
| JBM Auto | 160 | 118 | 115 | +35.59% | +39.13% |
| Pinnacle Mobility Solutions | 155 | 55 | 12 | +181.82% | +1191.67% |
| Tivolt Electric Vehicles | 122 | 129 | 26 | -5.43% | +369.23% |
| VE Commercial Vehicles | 122 | 116 | 89 | +5.17% | +37.08% |
| PMI Electro Mobility Solutions | 54 | 118 | 58 | -54.24% | -6.90% |
| Others | 90 | 148 | 130 | -39.19% | -30.80% |
| Total | 4,702 | 3,556 | 1,631 | +32.23% | +188.29% |
Source: FADA Research. Telangana (TS) CV registration data were unavailable for August 2026; data collated 04.09.2026 from 1,467 of 1,469 RTOs.
FADA does not break out EV penetration separately for LCVs, MCVs, and HCVs, so the 5.18% overall e-CV share should not be assumed uniform across these sub-segments; electrification is likely progressing unevenly by vehicle class and use-case. For context, overall CV retail (all fuels) grew 15.32% YoY in LCVs, 13.98% in HCVs and 10.38% in MCVs — meaning even the base categories that e-CV sits within are growing at different speeds, which likely compounds into uneven EV adoption rates across truck classes.
EV Penetration: 2W vs 3W vs PV vs CV
| Segment | Aug 2025 EV Share | Aug 2026 EV Share | Change | Interpretation |
| Two-Wheelers (2W) | 7.66% | 10.68% | +3.02 pp | Crossed 10% in a non-festive month |
| Three-Wheelers (3W) | 56.63% | 65.30% | +8.67 pp | India’s most electrified major vehicle category |
| Passenger Vehicles (PV) | 5.83% | 7.63% | +1.80 pp | Lowest EV penetration among the four |
| Commercial Vehicles (CV) | 2.06% | 5.18% | +3.12 pp | All-time-high EV penetration |
Source: FADA Research. Note: August 2026 three-wheeler and commercial-vehicle registration data are not available for Telangana, according to FADA. The electric 3W and e-CV unit figures are based on the supplied FADA Research data table.
What August 2026 Means for India’s EV Transition
Three-wheelers remain India’s most electrified major vehicle category, while commercial vehicles are showing the fastest percentage growth from a much smaller EV base. Two-wheelers are approaching mainstream adoption at 10.68%, and passenger EVs continue to gain share slowly, holding the lowest EV penetration of the four categories at 7.63%.
This doesn’t mean passenger EVs are failing — PV alternative fuels, CNG, hybrid and EV combined, reached 41.95% in August 2026, overtaking petrol/ethanol at 40.85% for the first time. But within that mix, EVs specifically remain the smallest contributor, trailing both CNG and hybrid.
Commercial vehicles also carry the added complication of a widening monsoon deficit and rural stress. While tractors were hit particularly hard in August, overall three-wheeler and commercial-vehicle retail remained positive YoY, even as EV penetration continued to rise within both categories.
What to Watch Through the End of 2026
FADA’s broader dealer survey found that 81.62% of dealers expect growth over September-October-November. That is a whole-industry outlook rather than an EV-specific forecast. For electric 3Ws and CVs, the festive period will help determine whether August’s strong penetration and volume trends are durable — including whether three-wheeler penetration can extend past 65%, whether e-CV’s record volumes hold up as a new price round takes effect from September, and whether OEM-level EV growth converges or continues to be led by a handful of players like Bajaj, Tata Motors, and Euler Motors.
Key Takeaways:
- Electric three-wheelers accounted for 65.30% of three-wheeler retail in August 2026, up from 56.63% a year ago — India’s most electrified major vehicle category by far.
- Electric CV penetration hit a record 5.18%, up from 2.06%, with e-CV unit sales up 188.29% YoY to an all-time monthly high of 4,702 vehicles, though from a small base.
- Bajaj Auto led e-3W retail (13,833 units, +117.19% YoY); Tata Motors led e-CV retail (1,416 units, +216.07% YoY).
- Two-wheeler and passenger EVs are growing too, but from a much lower base — 10.68% and 7.63% penetration respectively, with PV holding the lowest EV penetration of the four segments.
- FADA says August 2026 registration data for three-wheelers and commercial vehicles are not available for Telangana, so these figures should be read as excluding that state.
Stay connected via Google 'Electric Vehicle' News
Follow BijliWaliGaadi | India's Trusted EV Insights Portal
source on Google